
Case studies
Proven on working land.
What the platform does is best told by the ground it has already served: more than 450,000 acres across North America, and working deployments in the UAE. These are operating results, measured on real farms, with the method plain and the limits stated.
Water and forage
60% less water on alfalfa, Ras Al Khaimah, UAE.
The problem
Alfalfa is among the thirstiest crops grown anywhere, and in the Gulf it is commonly irrigated far past what the plant can use, because the schedule is set by habit rather than by what the field is actually holding. On a working farm in Ras Al Khaimah, that meant water pumped every day into ground that often did not need it.
What the platform did
The farm's fields were registered on the platform and read from space on every clear pass. Satellite observation of crop condition and soil moisture, combined with local weather and evapotranspiration, fed an irrigation model that answered one question each day: does this field need water today, and how much. Irrigation followed the model's advice instead of the calendar.
The result
Irrigation water fell by approximately 60% against the farm's previous practice, while the farm continued to produce 70 to 80 tons of alfalfa. The saving repeated cycle after cycle, because it came from a permanent change in how the decision is made, not from a one-off intervention.
Why it matters beyond one farm
Forage crops are among the largest agricultural water consumers in arid countries. A result of this size, achieved on the region's own soil and climate, scales: the same observation, the same model and the same daily question apply to every irrigated field, and the platform applies them automatically once a farm is registered.
01
For municipalities

Parks and public landscapes run on the same daily question, with every tank, pump and valve visible in a live digital twin. Waste surfaces as an alert, faults are caught by the system, and savings are measured per site rather than assumed.
02
For irrigation farmers
Each field gets its own answer each day: water now, or not, and how much. The seasonal maps below are this platform reading this farm; the same reading runs automatically for every registered field, and the water bill follows the crop instead of the calendar.
03
For forestation and rain-fed land
Where nobody irrigates daily, the same watching still pays: planting programmes are followed through establishment, the blocks that need water to survive are named while intervention is cheap, and rain-fed condition is tracked season over season.
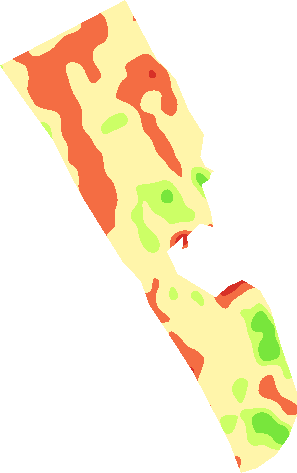
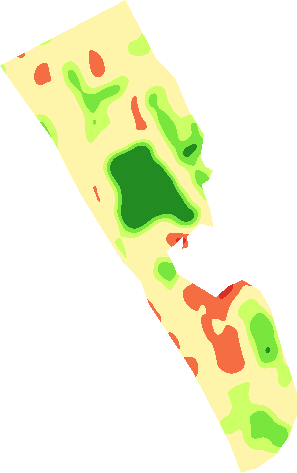
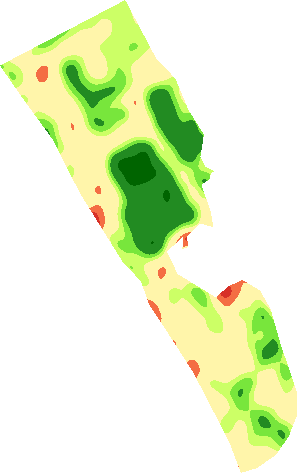
The farm as the platform reads it, three dates from the season. Deep green is vigorous growth, pale is dormant or cut, red is ground worth walking to. These are actual platform outputs for this farm, each carrying its own observation date.
See it on your own land